First Steps with PartFinder
1. Select a Camera
Select and open the camera you want to use in NxView. For this guide, we will use the t_pipe file camera that is available on our website. Follow the guide on using sample data for more information on how to download and set up this camera.
Note that you will need an STL or PLY model of the parts you want to detect in the point cloud. For the t_pipe camera, such a model is provided on our website.
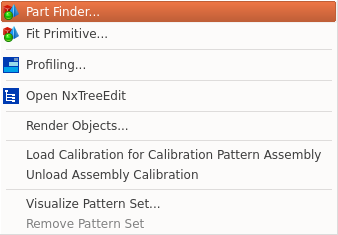
3. Create a Model
PartFinder uses a multi-step procedure that is explained in the command documentation. Following this procedure, we have to generate a model before we can use it to find parts.
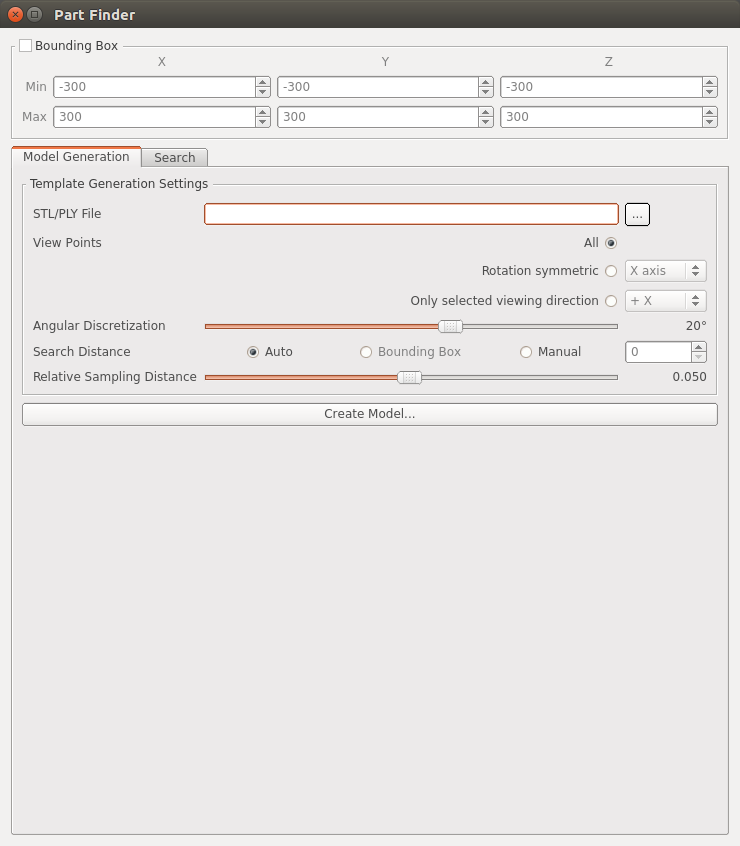
Select your STL or PLY file.
If your model is symmetric or will only be observed from a certain direction, you can select the view point options accordingly. This is optional, but will improve performance for such situations. The
t_pipeis not symmetric, so we leave this at the default.You can leave the other options at their default values for now. If you want to experiment with them, see the command documentation or the tooltips in NxView for more information on what the different parameters do.
Click
Create Model...to generate the model.
4. Search for Parts
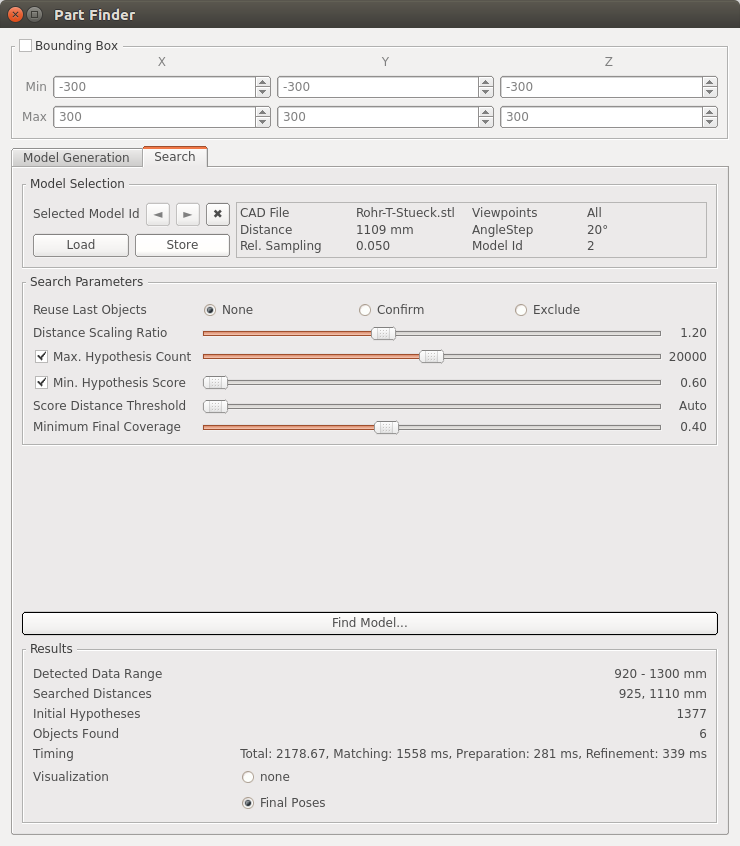
Switch to the
Searchtab in the part finder dialog.You can leave most search parameters at their default values for now. For the
t_pipescene, you might have to decrease or disable the Min. Hypothesis Score parameter in order to find all occurrences of the model in the 3D data. When you do not change this parameter, PartFinder will only find the best matches in the scene.Click on
Find Model...to start the search.When the search is done, the dialog will show the number of detected parts at the bottom.
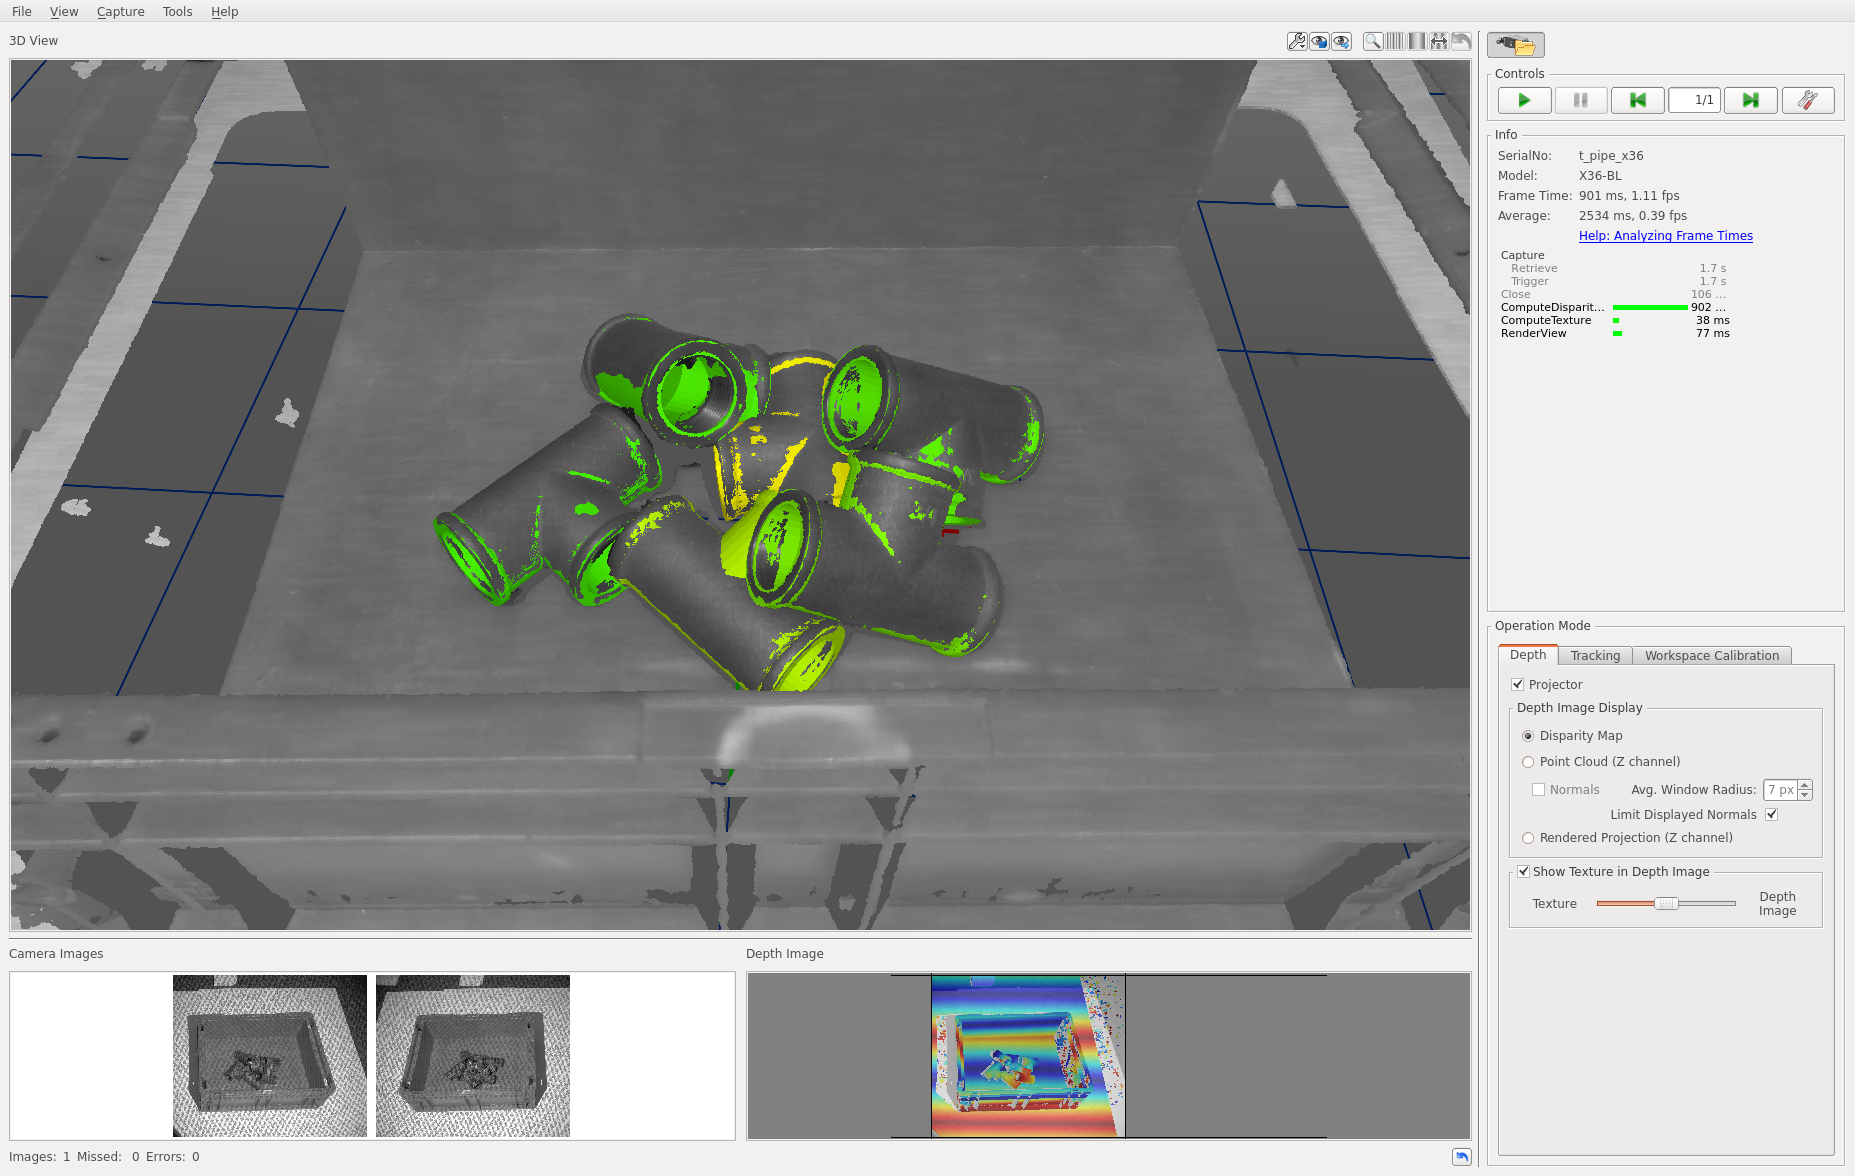
The detected parts will also be visualized in NxView’s 3D view. The color of the visualization indicates the coverage of the match. Good matches will be green, worse matches (where e.g. some parts are occluded) will be orange.